performance and benchmark
More performance and benchmark results will be added in the future. If you have any interesting usecases or ideas, feel free contact us!
Table of Contents
Improve performance
There are several configs to improve the performance of bpftime:
- Use JIT when running the eBPF program. The JIT will be enabled by default in the future after more tests. See documents/usage.md for more details.
- Compile with LTO enabled. See documents/build-and-test.md for more details.
- Use LLVM JIT instead of ubpf JIT. See documents/build-and-test.md for more details.
- Disable logs. See documents/usage.md for more details.
The benchmark results are based on the above configs.
Benchmark
Microbenchmark
See https://github.com/eunomia-bpf/bpftime/tree/master/benchmark for how we run the benchmark.
| Probe/Tracepoint Types | Kernel (ns) | Userspace (ns) |
|---|---|---|
| Uprobe | 3224.172760 | 314.569110 |
| Uretprobe | 3996.799580 | 381.270270 |
| Syscall Tracepoint | 151.82801 | 232.57691 |
| Embedding runtime | Not avaliable | 110.008430 |
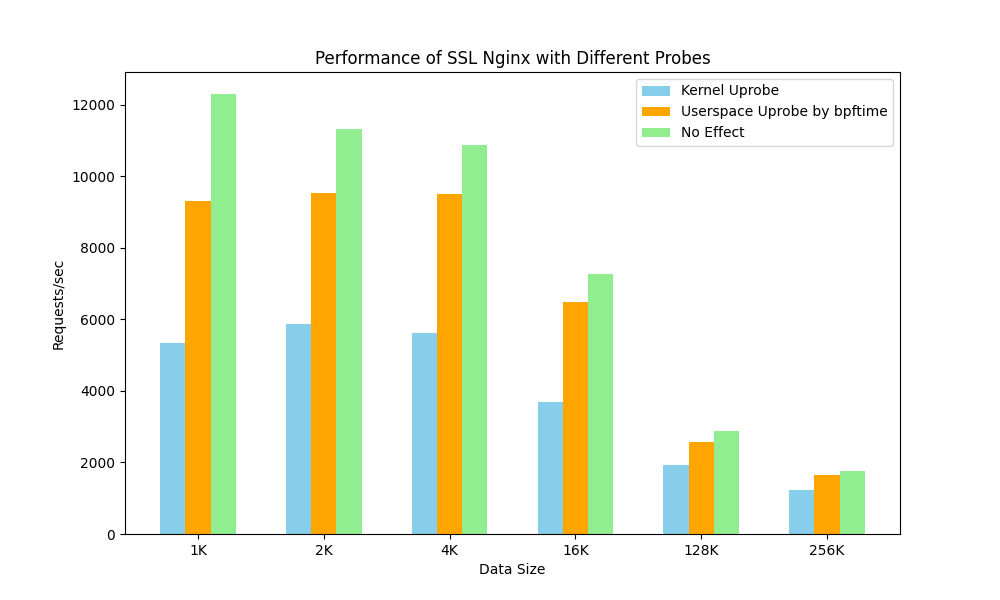
sslsniff: trace SSL/TLS connections and raw traffic data
We used the sslsniff tool to trace and analyze SSL encrypted traffic of Nginx in bpftime's user-space Uprobe and compared it with the kernel Uprobe approach, observing a significant performance improvement:

The benchmark script and results can be found in benchmark/sslsniff.