
AgentSight Flamegraph Gallery
AgentSight's semantic flamegraphs connect agent intent to observable activity. Each horizontal frame adds context to the stack, while frame width represents the selected metric: token volume, elapsed time, file activity, or network activity. The examples below use checked-in, regenerable folded-stack outputs from local development sessions.
AgentSight Development Time
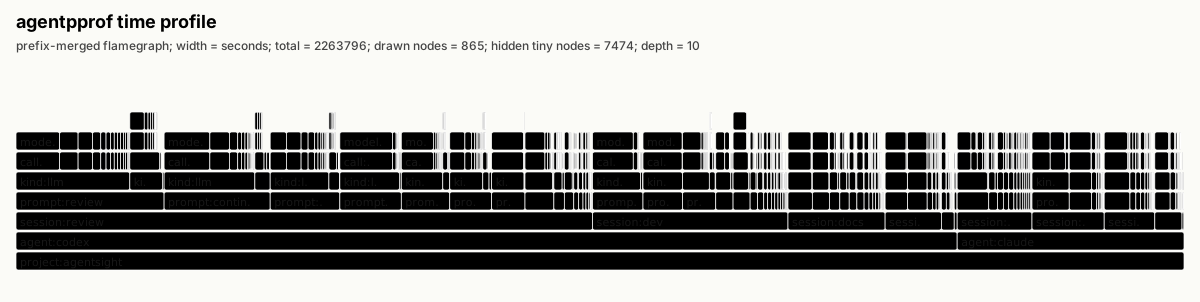
This profile uses real AgentSight development sessions. Width represents
elapsed seconds, and the uneven stack height comes from optional LLM, tool, and
event frames. It is the closest project-native example to a traditional CPU
flamegraph silhouette. Regenerate it with agentsight.sh.
AgentSight Token Cost
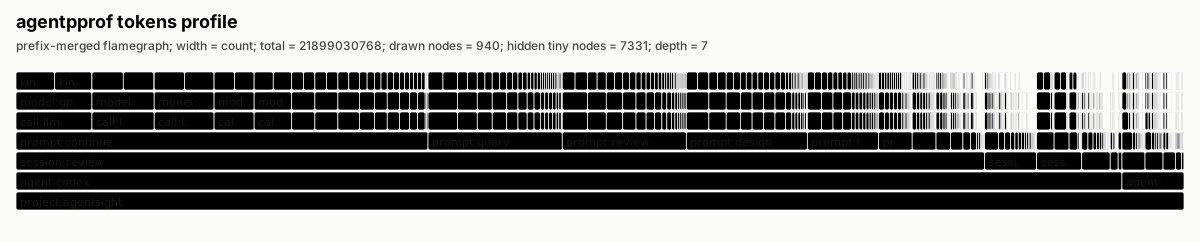
This profile uses the same AgentSight development sessions as the time view,
but width represents token count. Use it when the question is where model
budget went rather than where wall-clock time accumulated. Regenerate it with
agentsight.sh.
AgentSight File Activity
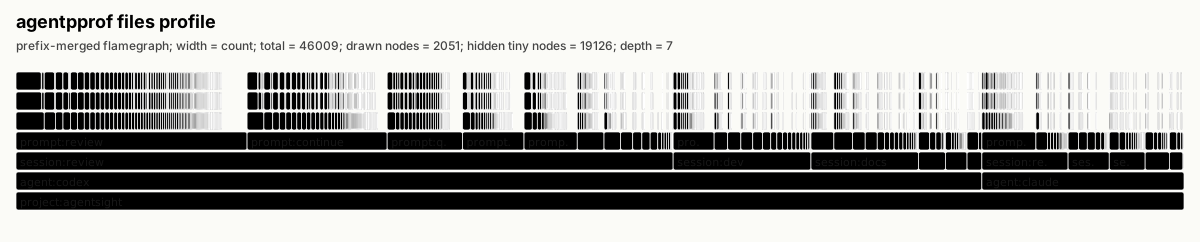
This profile groups local file effects by project, agent, prompt tag, path, and
operation result. Use it to inspect which code or artifact paths dominate an
agent run. Regenerate it with agentsight.sh.
BPF Benchmark Development Time

This profile uses real bpf-benchmark development sessions and also measures
elapsed seconds. Its variable-depth stacks produce the strongest ragged upper
outline in the gallery, making the separation between review, paper, naming,
benchmark, and editing sessions easy to see. Regenerate it with
bpf-benchmark.sh.
BPF Benchmark Network Activity

This profile uses real bpf-benchmark development sessions and groups observed
network destinations. Width represents event count. Regenerate it with
bpf-benchmark.sh.
Choosing a View
- Use AgentSight time when the example must come from this repository's own development history.
- Use AgentSight token cost when the example should explain model budget.
- Use AgentSight file activity when the example should explain local system effects.
- Use BPF benchmark time when a visibly variable stack silhouette matters.
- Use BPF benchmark network activity when the example should emphasize external service contact.
For the profiler data model, available views, tagging workflow, and CLI usage,
see docs/agentpprof.md.
Continue exploring
Back to index
AgentSight: System-wide AI agent profiling and monitoring with eBPF
  
Previous
Docker Usage
Use Docker when you want a packaged AgentSight runtime for container, CI, or isolated Linux environments.
Next
AgentSight: System-wide AI agent profiling and monitoring with eBPF
  
- Last updated
- Jul 15, 2026
- First published
- Jul 15, 2026
- Contributors
- github-actions[bot]
Was this page helpful?